Inspector
The GenomeSpy Inspector is a developer tool for looking at the live runtime state of a visualization. It shows the view hierarchy, encodings, scale/axis/legend resolutions, dataflow, params, and unit mark state.
Use the inspector when a visualization does not behave as expected and the specification alone does not explain the runtime state. Typical use cases include checking which views were created, how scales are shared, which params exist, and where rows flow through transforms.
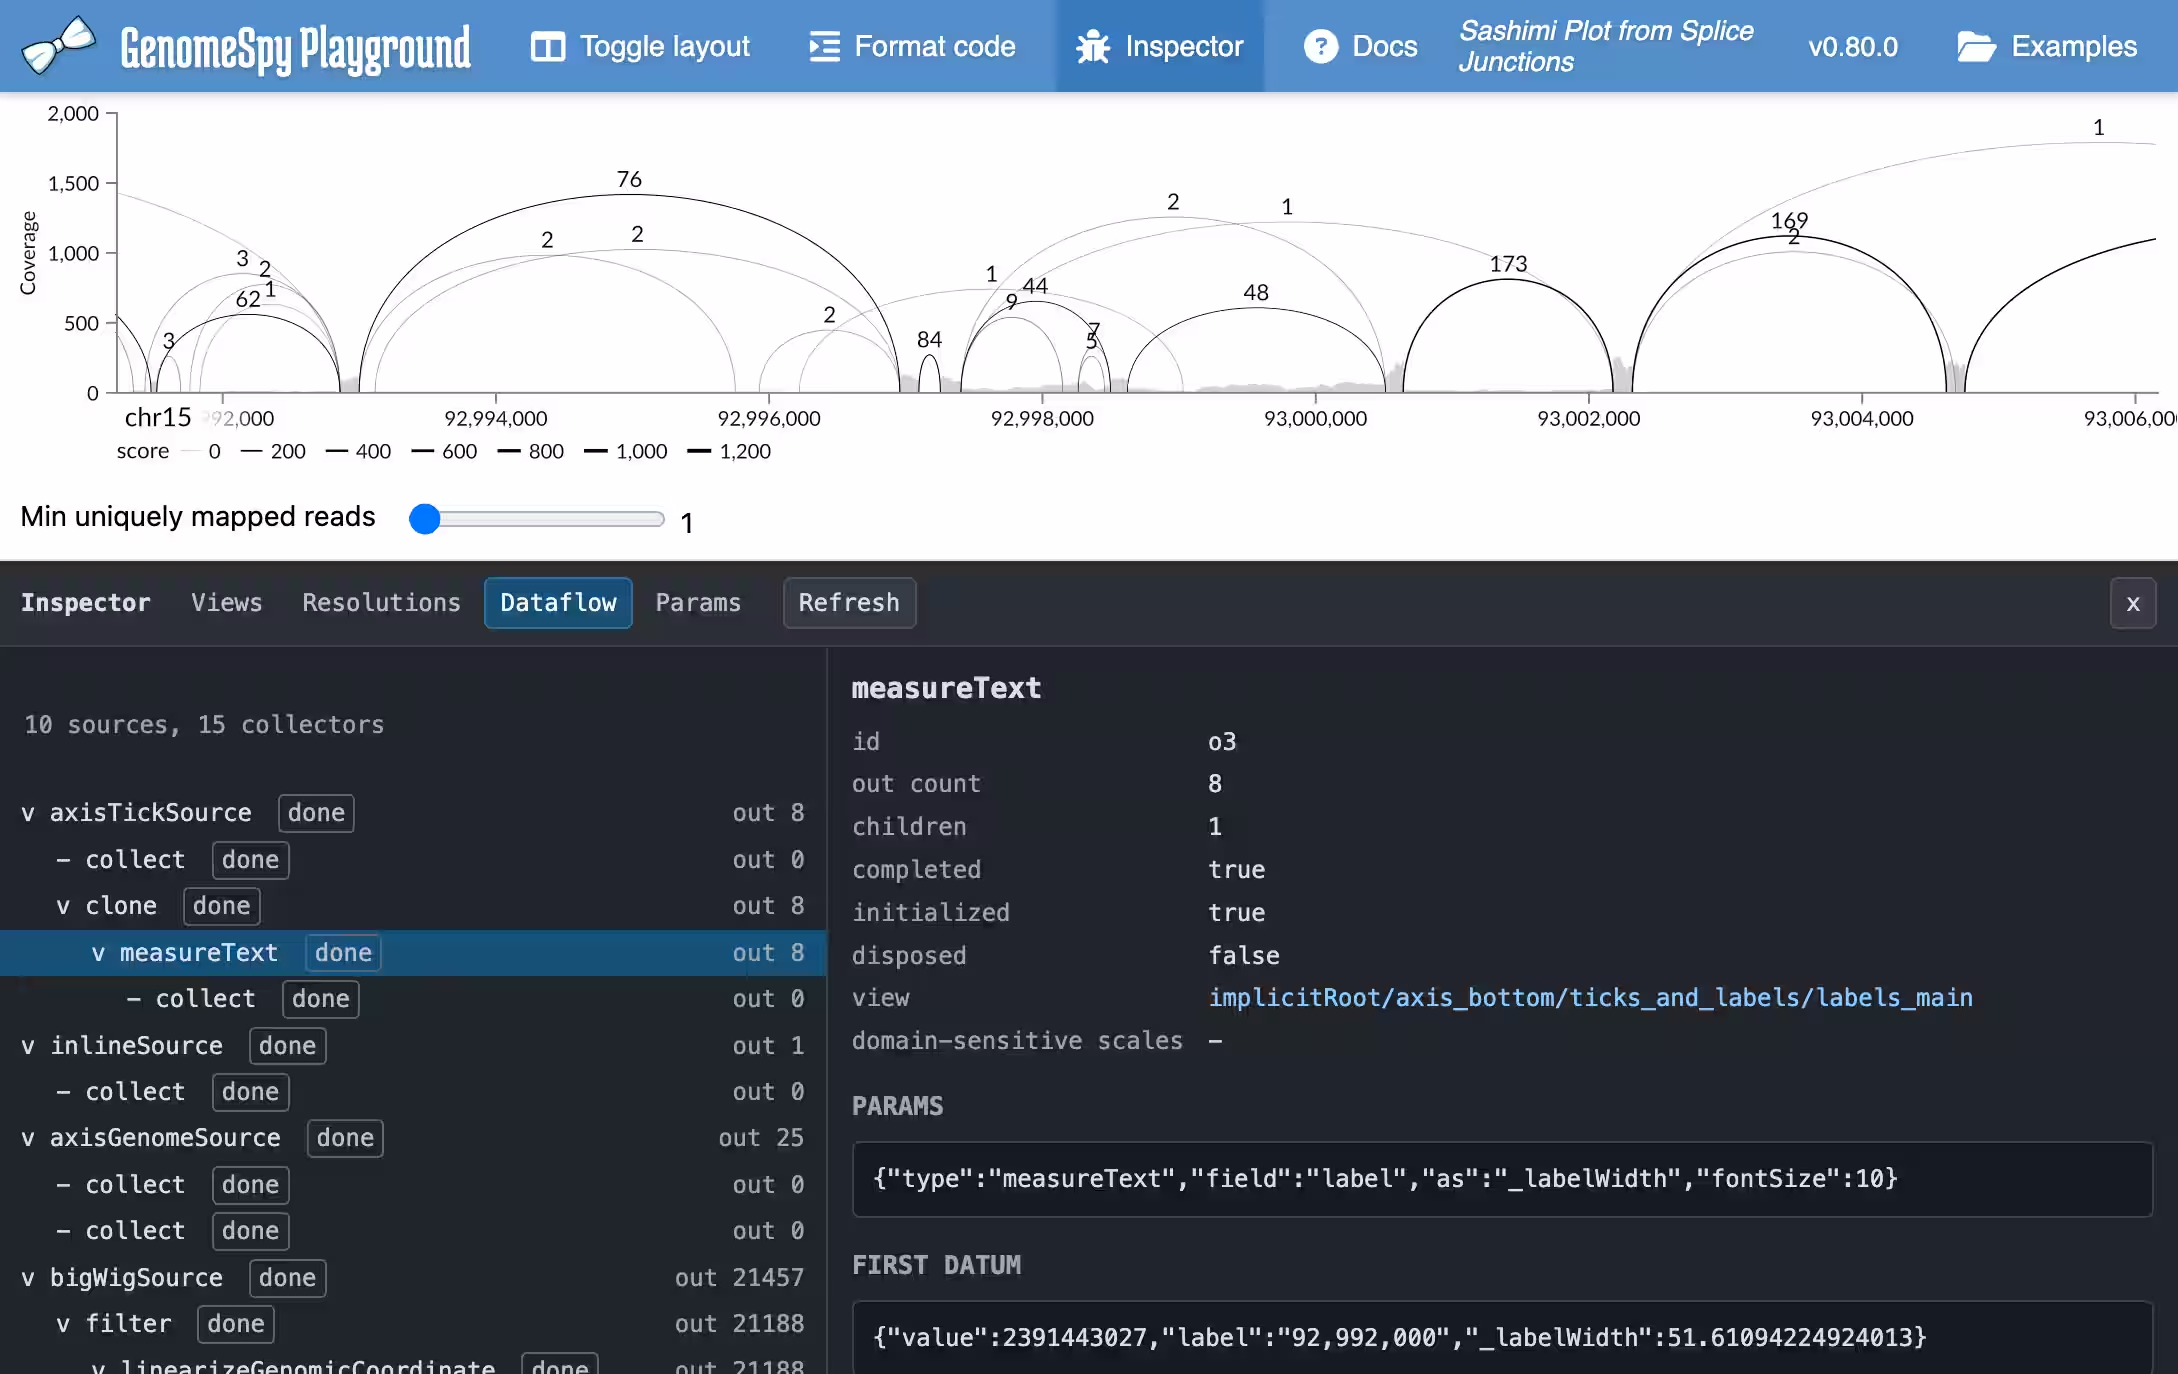
App
To use the inspector in GenomeSpy App, load the App and Inspector bundles, initialize App with the inspector plugin, and open the inspector from the three-dot menu in the App toolbar.
<!DOCTYPE html>
<html>
  <head>
    <title>GenomeSpy</title>
    <link
      rel="stylesheet"
      type="text/css"
      href="https://cdn.jsdelivr.net/npm/@genome-spy/app@1.2.0/dist/style.css"
    />
  </head>
  <body>
    <script type="module">
      import { embed } from "https://cdn.jsdelivr.net/npm/@genome-spy/app@1.2.0/dist/index.es.js";
      import { appInspector } from "https://cdn.jsdelivr.net/npm/@genome-spy/inspector@1.2.0/dist/index.es.js";

      await embed(document.body, "spec.json", {
        plugins: [appInspector()],
      });
    </script>
  </body>
</html>
This is the inspector-enabled variant of the App template used in Visualizing Sample Collections.
Bundled applications that install App through npm can add the inspector plugin explicitly:
import { embed } from "@genome-spy/app";
import { appInspector } from "@genome-spy/inspector";

await embed(element, spec, {
  plugins: [appInspector()],
});
Playground
GenomeSpy Playground includes an Inspector button in the toolbar. The button replaces the editor/file pane with the inspector, so the plot and inspector are visible side by side.
Core Embeds
Add an Inspector button to the optional embed controls:
import { embed } from "@genome-spy/core";
import { attachControls, pngButton } from "@genome-spy/core/controls";
import { inspectorButton } from "@genome-spy/inspector";

const api = await embed(element, spec);
const controls = attachControls(element, api, {
  controls: [pngButton(), inspectorButton()],
});

// Before removing the embed:
controls.dispose();
api.finalize();
The button loads the Inspector UI on demand. It follows full-window expansion
and closes when the controls are disposed. Options include text (instead of
the bug icon), title, width, and activePanel.
For direct browser imports, use the Inspector's dist/index.es.js and Core's
dist/src/controls.js with its relative module files available. These work with
Core's existing dist/bundle/index.es.js; no import map is required. Inspector
gets debug helpers through api.debug from the same Core runtime as the plot.
To manage an overlay from your own UI, use
const inspector = await attachInspectorOverlay(api.debug) and call
inspector.dispose() during cleanup.
For applications with their own panels or split layouts, use
createInspectorPanel(...) instead and place the returned panel element in
the application UI.
See the inspector overlay example for a complete Core embed.
Debug Scope
The inspector reads internal runtime objects through small debug hooks. Debug ids are session-local and should not be stored in application state or shared links.