GenomeSpy

GenomeSpy is a toolkit for creating interactive visualizations of genomic and other data. Its visualization grammar uses JSON specifications to describe what to display and how it should appear. You can combine charts and genome tracks into custom views, such as a genome browser. Software developers can write the JSON directly; bioinformaticians and data scientists may prefer GenomeSpy for Python, which builds the same specifications from Python chart definitions.
GenomeSpy Core renders these visualizations in a web browser. Its WebGL-based engine supports smooth interaction with datasets containing several million rows.
GenomeSpy App builds on Core for analyzing large sample collections, such as cancer cohorts. In a configured App, researchers can inspect genomic measurements alongside metadata and sort, filter, and group samples. If you are using an existing App, start with Analyzing Sample Collections.
Minimal genomic example
This illustrative copy-number view shows three segments on chromosome 3. The
x and x2 encodings place each segment along the genomic axis, and color
distinguishes loss, neutral, and gain.
{
  "description": "Illustrative copy-number states along chromosome 3",

  "assembly": "hg38",

  "data": {
    "values": [
      { "chrom": "chr3", "start": 500000, "end": 560000, "state": "loss" },
      { "chrom": "chr3", "start": 560000, "end": 830000, "state": "neutral" },
      { "chrom": "chr3", "start": 830000, "end": 900000, "state": "gain" }
    ]
  },

  "scales": {
    "x": {
      "domain": [
        { "chrom": "chr3", "pos": 450000 },
        { "chrom": "chr3", "pos": 950000 }
      ]
    }
  },

  "mark": "rect",

  "encoding": {
    "x": {
      "chrom": "chrom",
      "pos": "start",
      "type": "locus",
      "axis": { "title": "Position on chr3" }
    },
    "x2": { "chrom": "chrom", "pos": "end" },
    "color": {
      "field": "state",
      "type": "nominal",
      "scale": {
        "domain": ["loss", "neutral", "gain"],
        "range": ["#4e79a7", "#d8d8d8", "#e15759"]
      }
    }
  }
}
More genomic examples
The same grammar supports more specialized views. These examples show translated sequence context and splice-junction evidence.
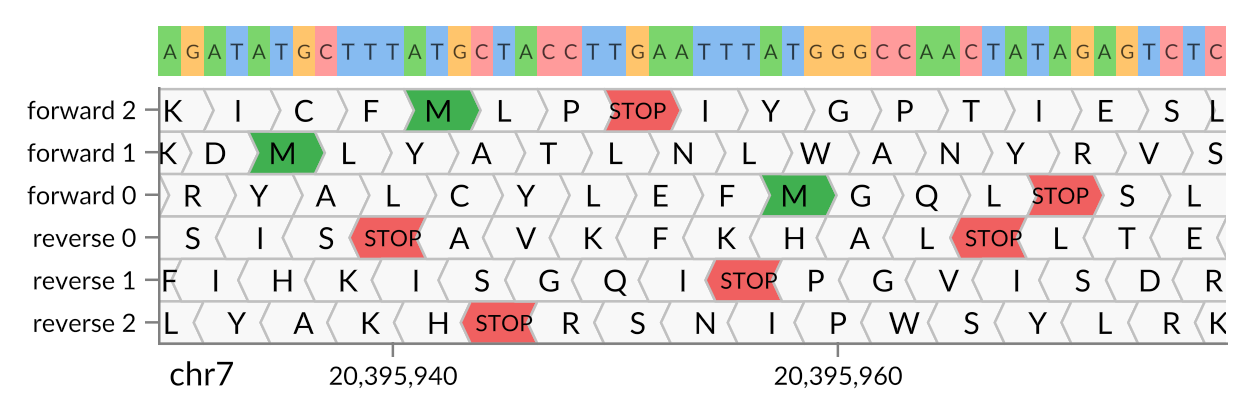 Indexed FASTA Six-Frame Translation
Translates a visible hg38 FASTA interval in three forward and three reverse reading frames using generic flattenSequence, lookup, window, and formula transforms.
Indexed FASTA Six-Frame Translation
Translates a visible hg38 FASTA interval in three forward and three reverse reading frames using generic flattenSequence, lookup, window, and formula transforms.
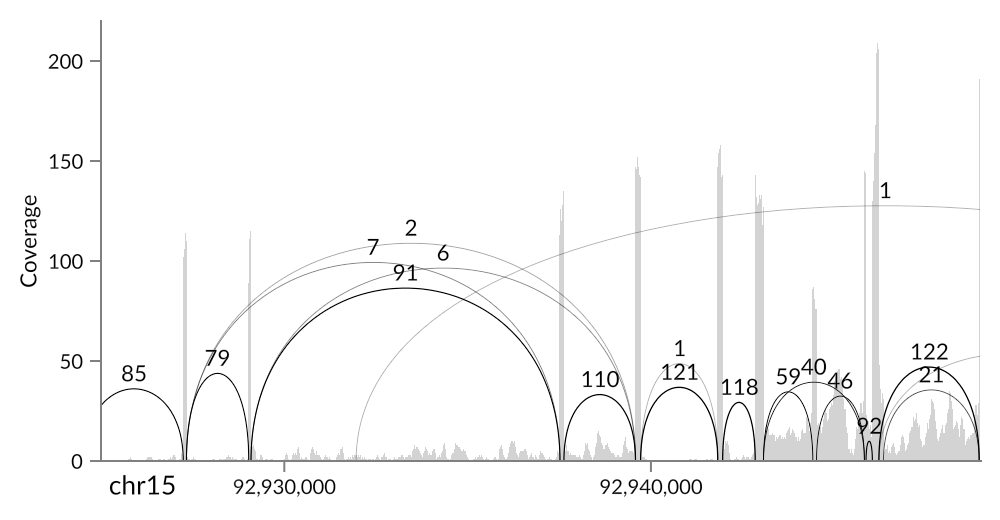 Sashimi Plot from Splice Junctions
Recreates IGV's splice-junction demo as a lazy BigWig coverage track with dome-shaped BED splice arcs, score labels, and a minimum-read threshold control.
Sashimi Plot from Splice Junctions
Recreates IGV's splice-junction demo as a lazy BigWig coverage track with dome-shaped BED splice arcs, score labels, and a minimum-read threshold control.
See Genomic Data Examples for the full list.
About
GenomeSpy is developed by Kari Lavikka and contributors. It originated in 2018 as his Master's thesis project in The Systems Biology of Drug Resistance in Cancer group at the University of Helsinki.
This project has received funding from the European Union's Horizon 2020 Research and Innovation Programme under Grant agreement No. 965193 (DECIDER) and No. 847912 (RESCUER), the Sigrid Jusélius Foundation, the Cancer Foundation Finland, and Orion Research Foundation.