GenomeSpy for Python
Interactive genomic visualization with GenomeSpy, using Altair-style Python syntax.
 GFF3 gene annotations
 Ovarian cancer GISTIC landscape
 Manhattan plot
 RNA-seq volcano plot
 PIK3CA mutation lollipop plot
 Multiple sequence alignment
 Interactive purity and ploidy fitting
 Heatmap
 RNA-seq MA plot
 Candidate regulatory elements
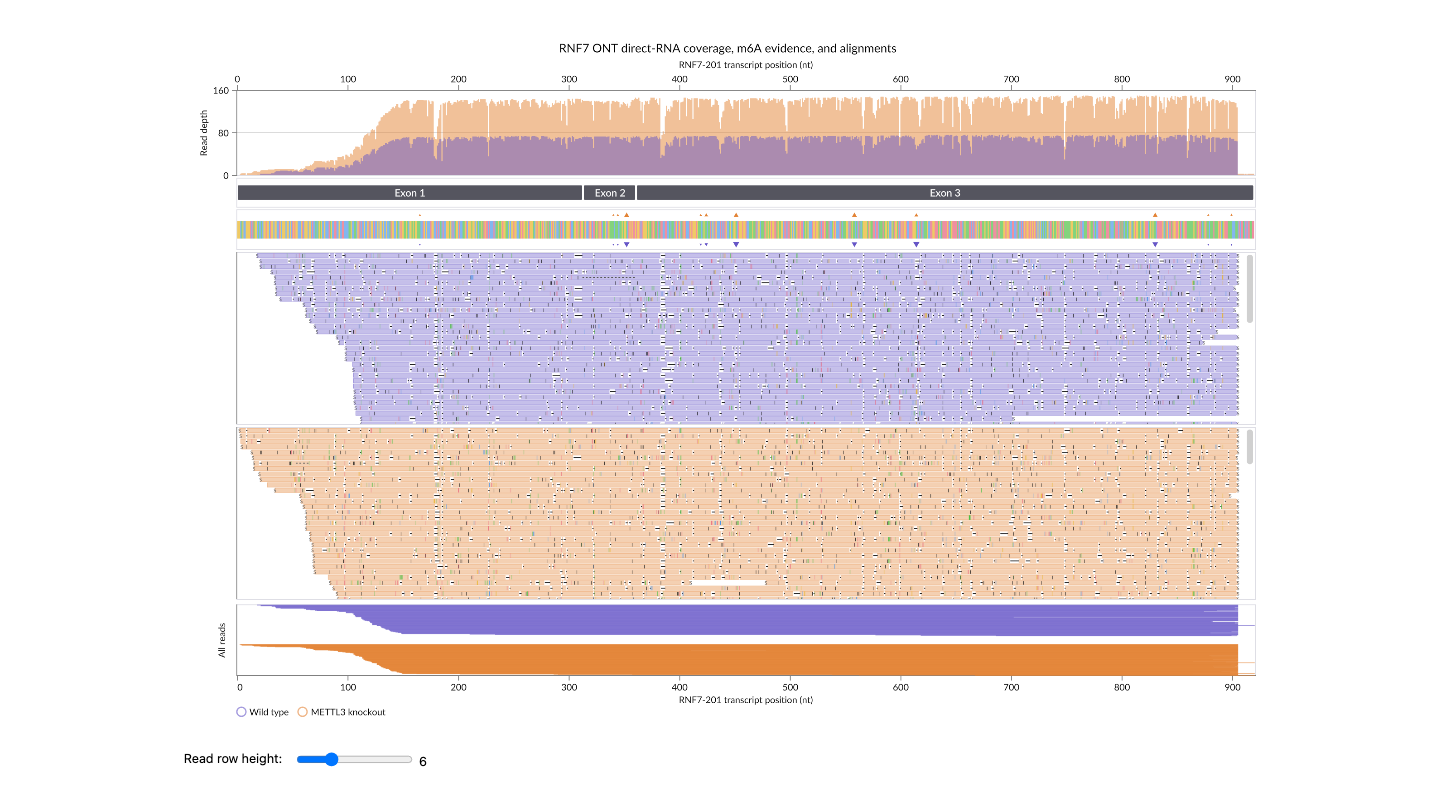
 BAM read alignments
 Brush-linked Manhattan plot
 Oncoplot with pathways and clinical tracks
 Variant classifications
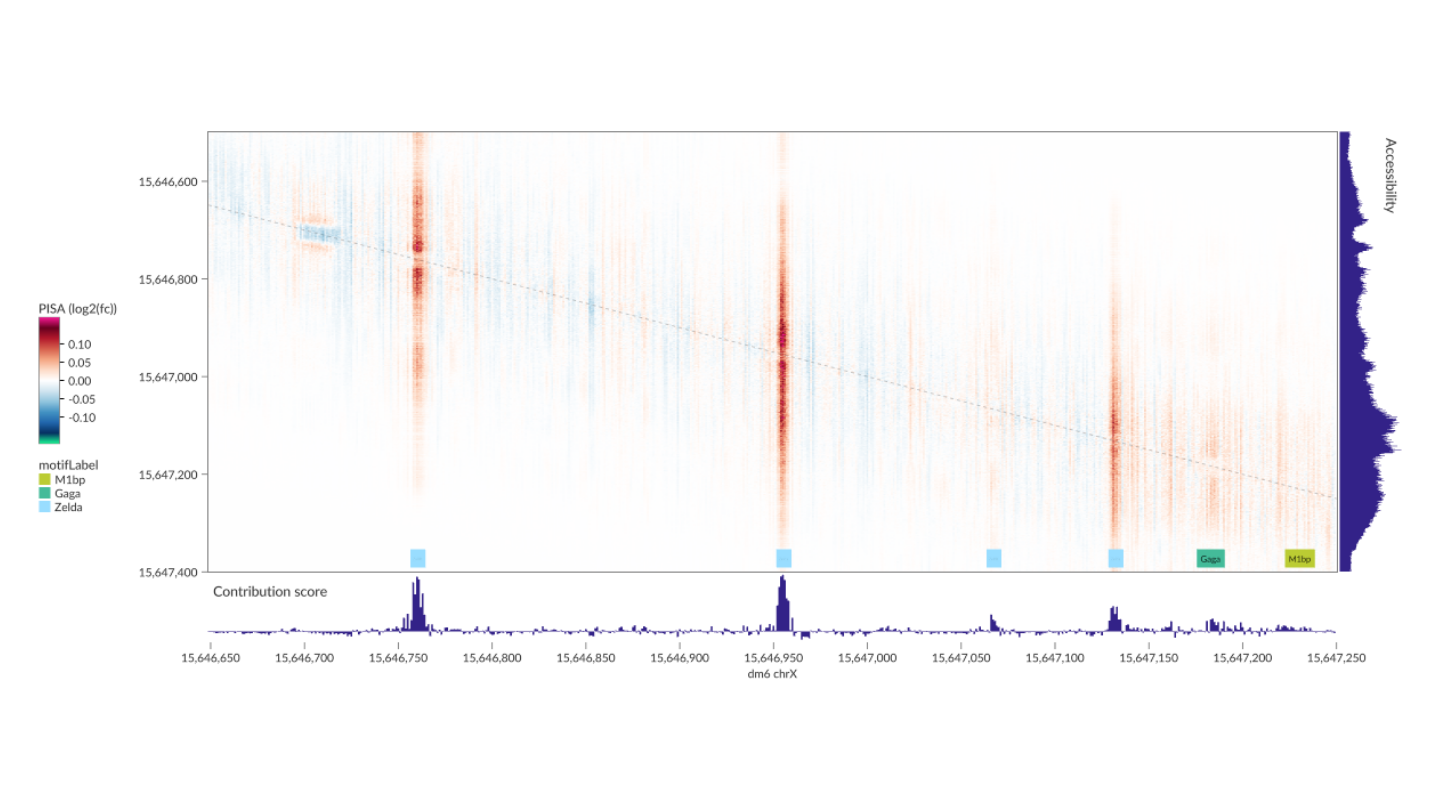
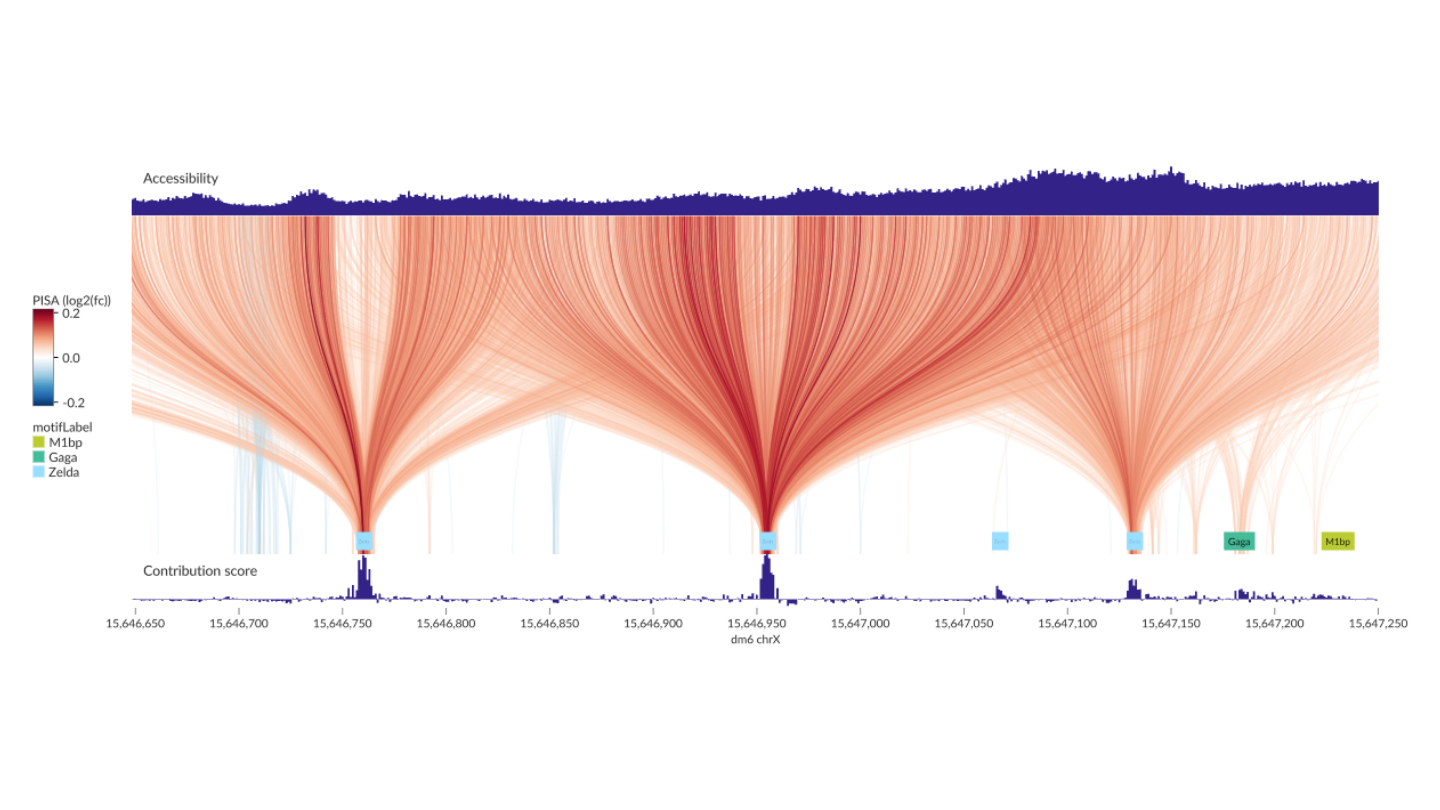
 Reference and alternate allele contributions
 Chromosome ideogram
 Allele-specific copy-number profile
 Genome browser from imported charts
 Lung cancer oncoprint
 Structural variants and copy number
 DNA sequence track
 Connecting intervals
 GC content with gene annotations
 DNMT3A mutation lollipop plot
 Brush-linked protein alignment
 Mutation oncoplot
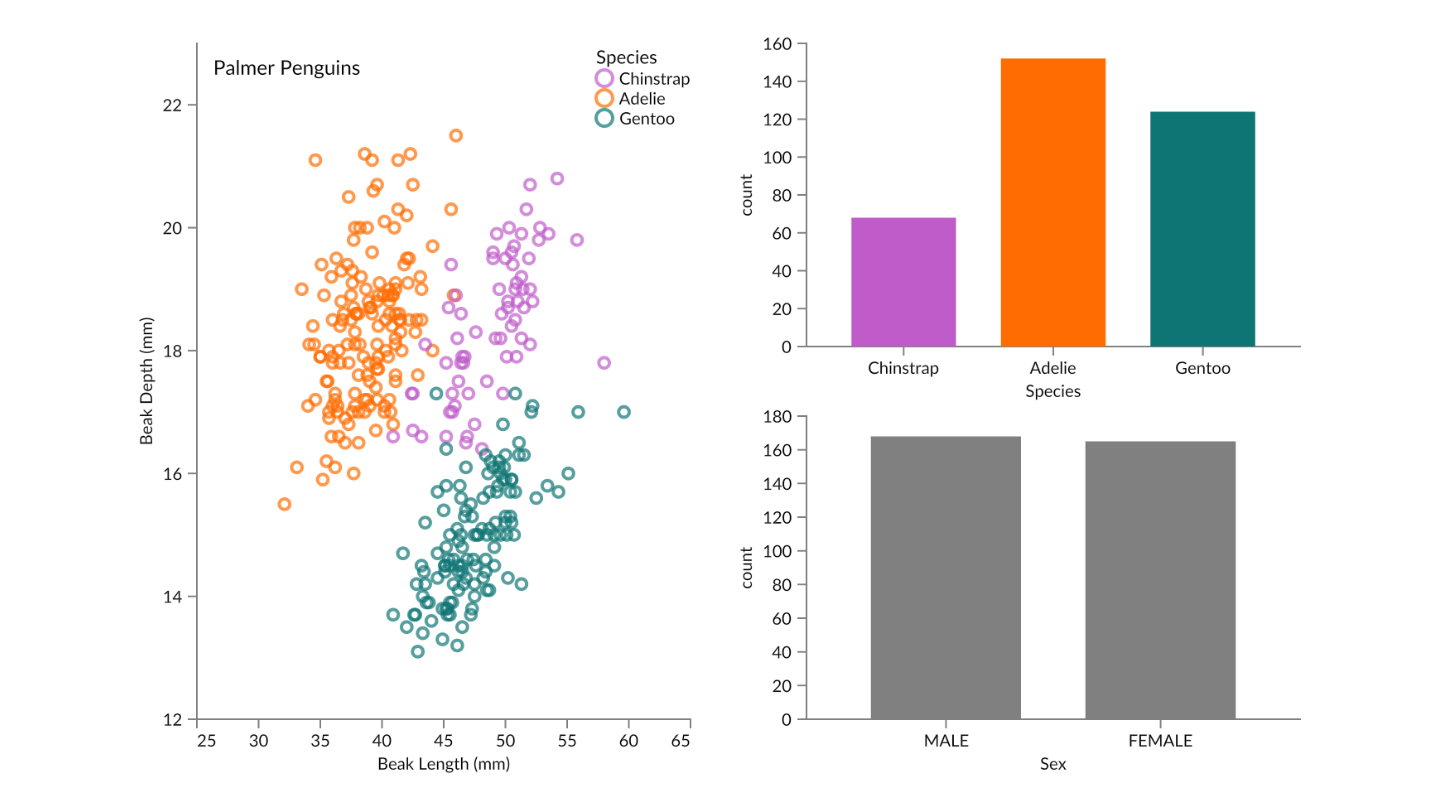
 Scatter plot
 Mutation rainfall plot
 Drawing intervals with rules
 Copy-number segmentation
 Linked genome browser tracks
 Splice junctions with a sashimi plot
 Scrollable plot
 DNA sequence logo
 Six-frame translation
 Gene annotations with prioritized labels
 BAM coverage and read pileup
 Clustered heatmap with dendrograms
 Coverage and interval pileup
 Positive and negative bars
 Zoom-adaptive allele contributions
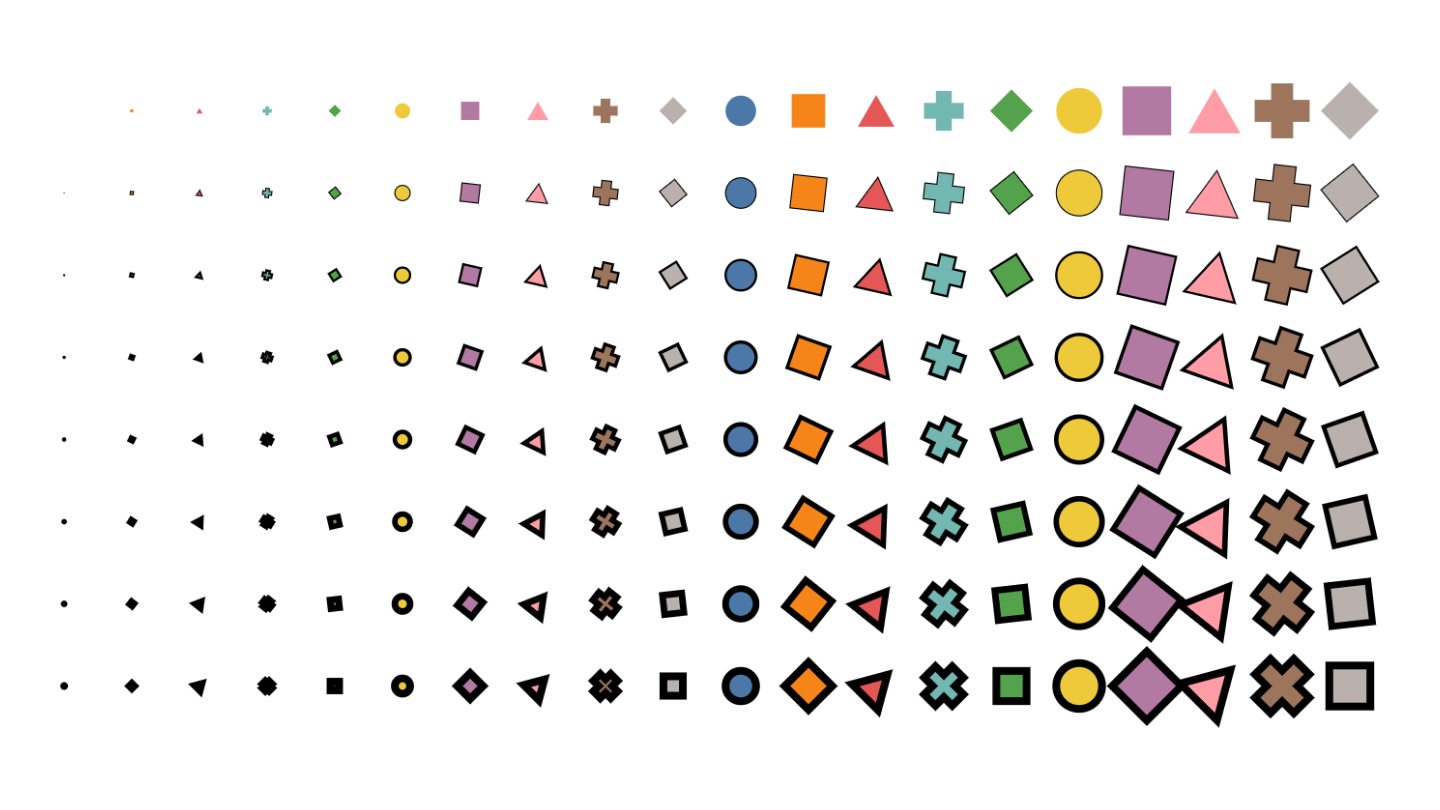
 Points that grow when zooming
 Heatmap with zoomable values
 Layered charts with independent scales
 Layered lollipop plot
 PBMC cell heatmap
 PBMC expression tracks
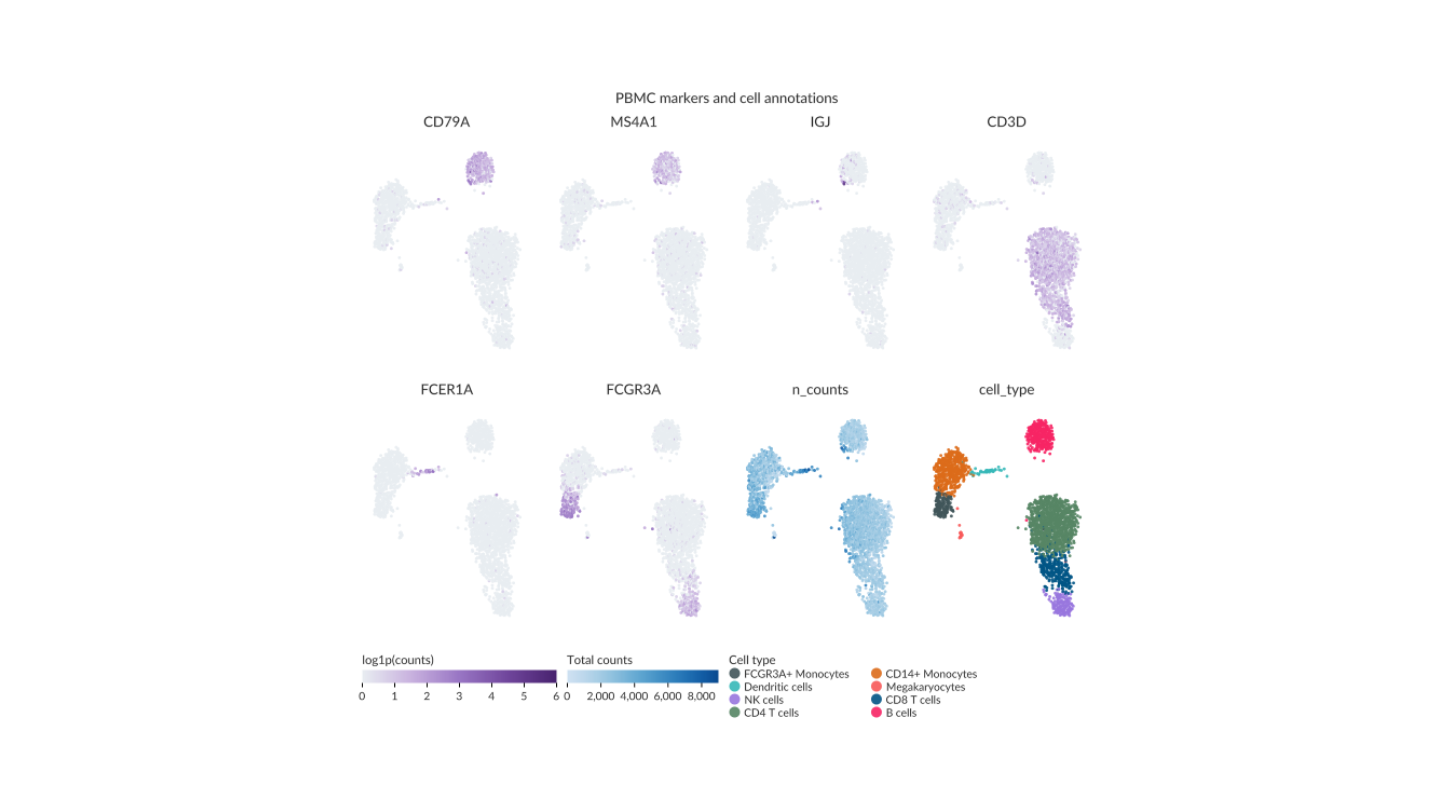
 PBMC marker matrix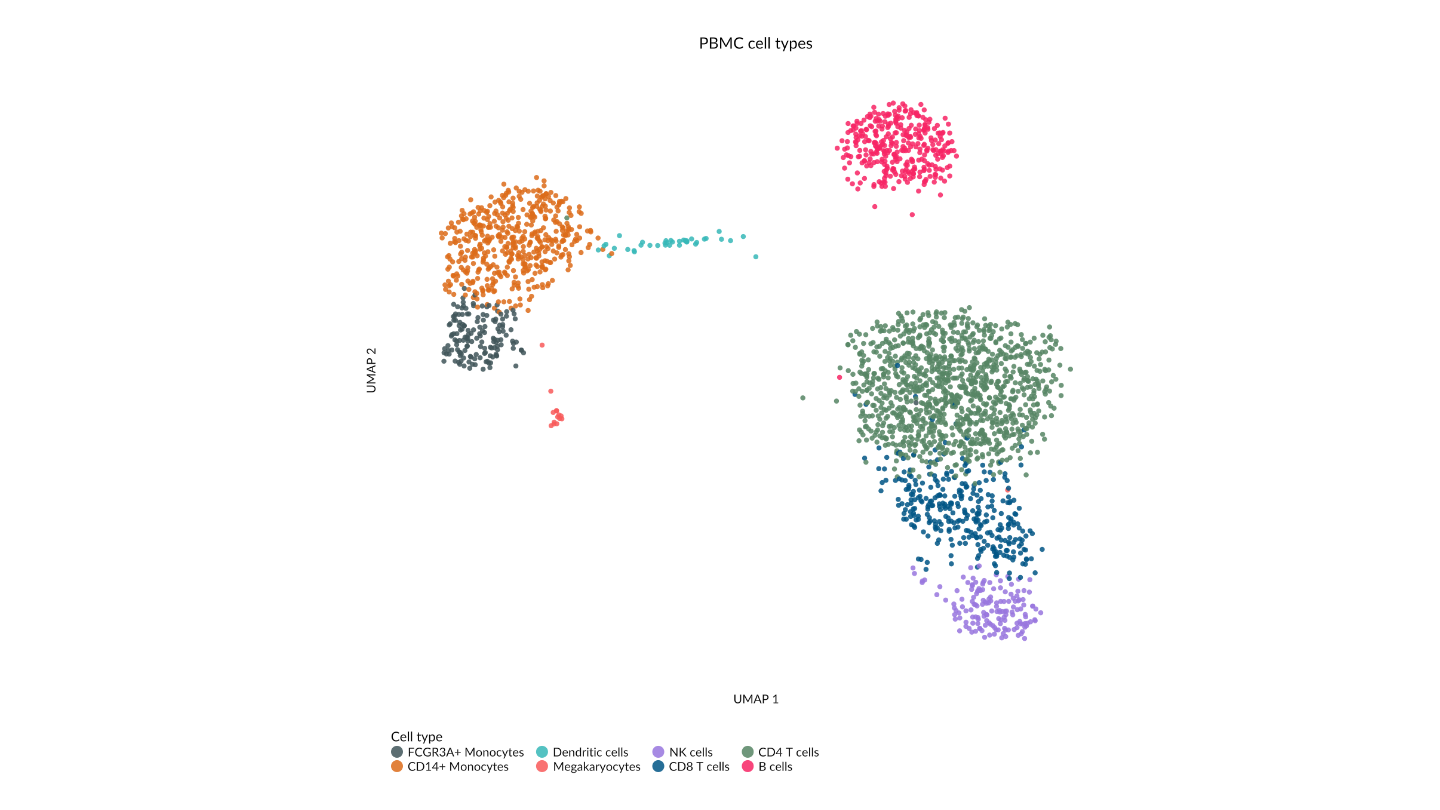
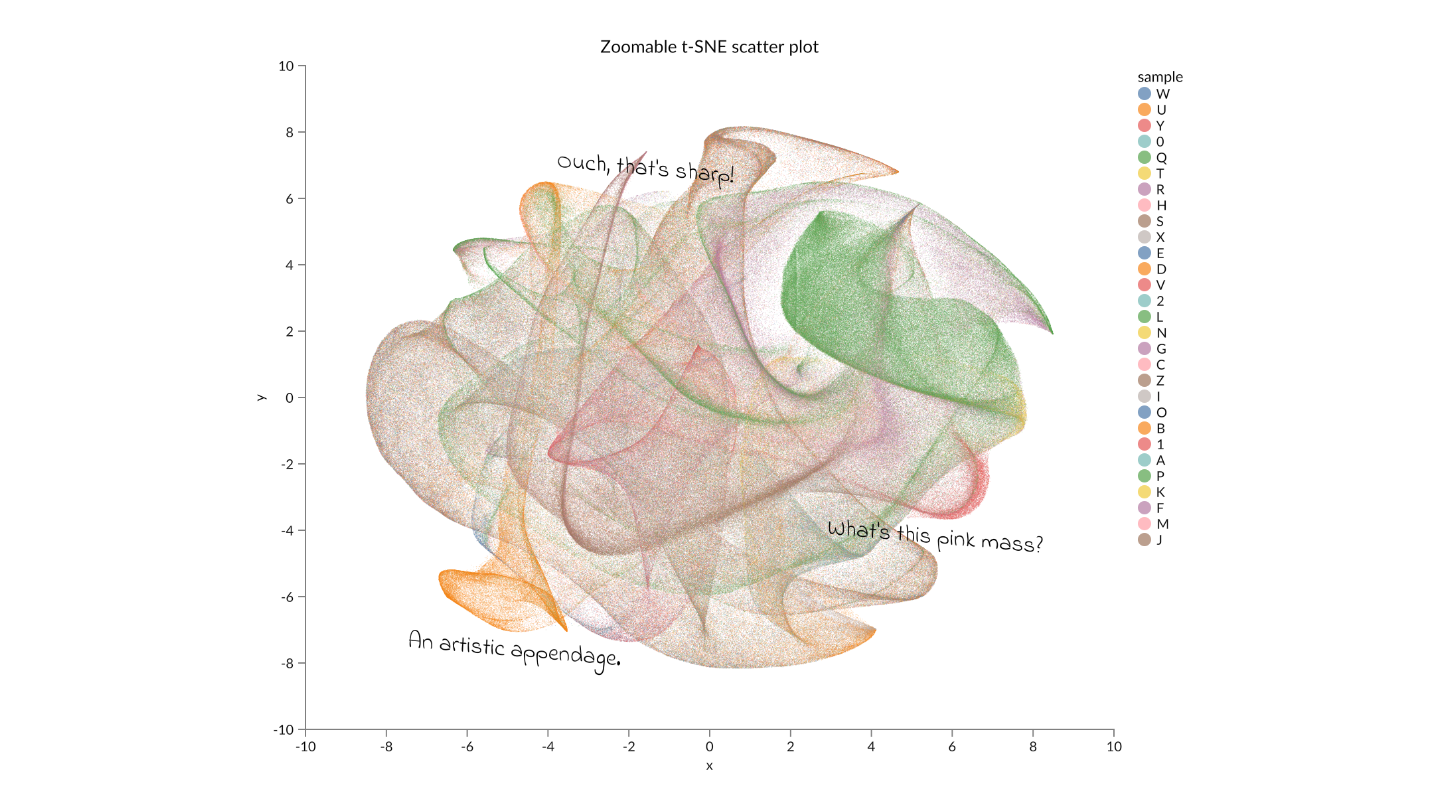
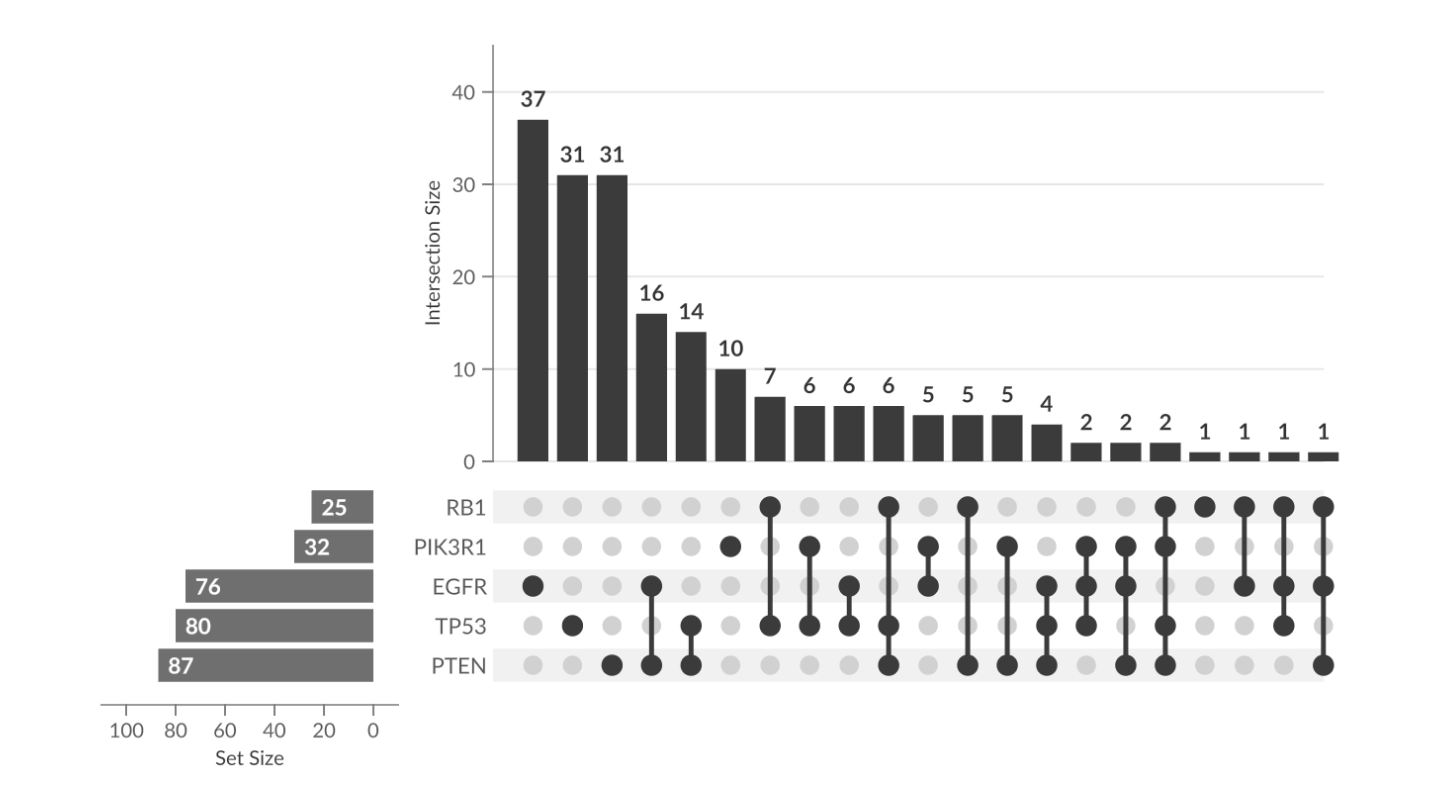
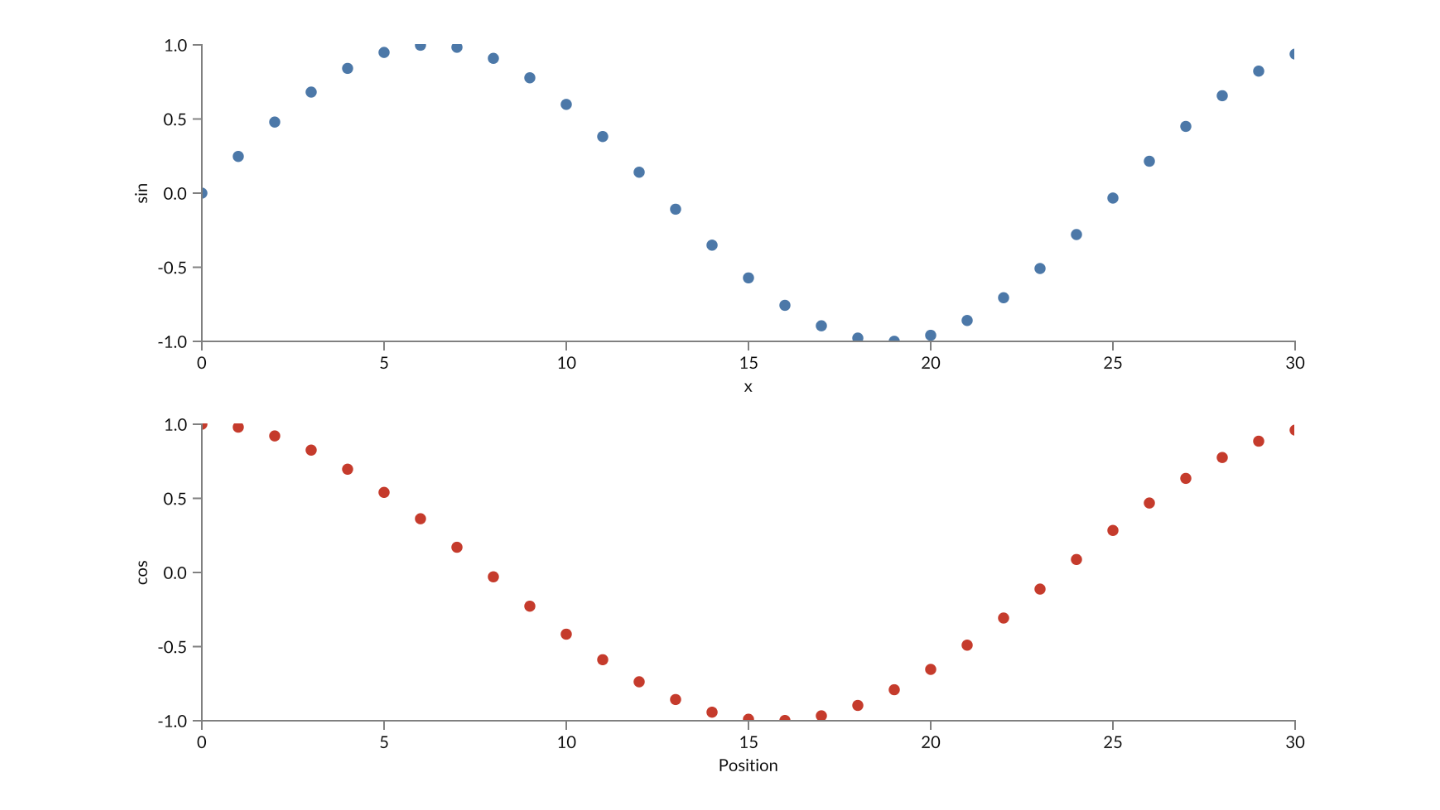
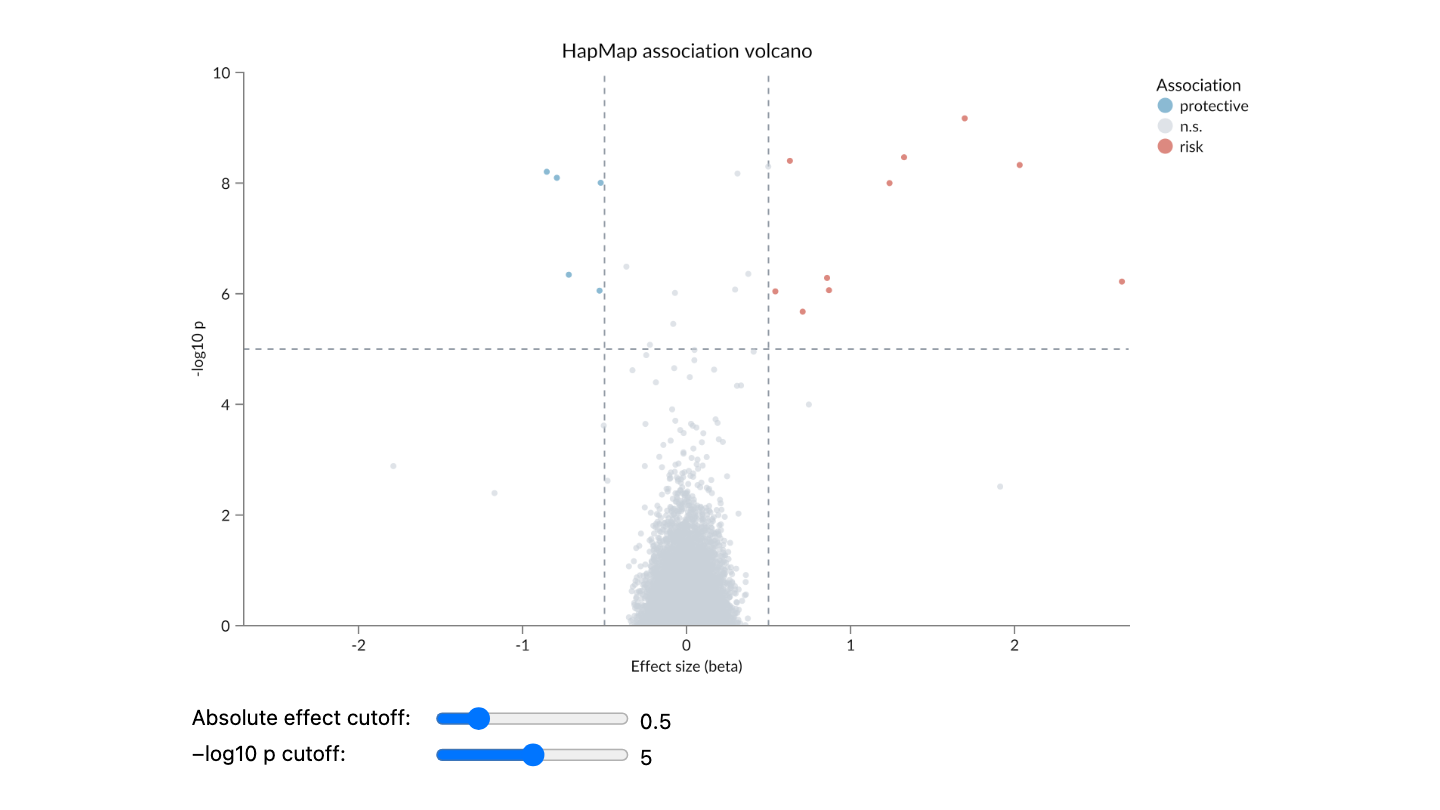
genome-spy-python builds validated GenomeSpy specifications from Python chart definitions. Display them in notebooks or web pages with chromosome-aware zooming and panning. The GenomeSpy documentation describes the underlying grammar in full.
Install the library and build your first interactive chart.
Learn the marks, encodings, composition, and genomic axes.
Browse interactive, genomics-native examples with source code.
Detailed reference for the public Python API.
Annotate genomic intervals or select genes for follow-up—in your browser or a notebook.
Agent documentation. Agents can use the Markdown documentation index to find focused guides, categorized gallery examples, and Python API signatures.